The S&P closed at 1092 today, exceeding my outer 4 standard deviation Keltner Channel (50,4.0,25). I use these Keltner Channels to help identify overbought and oversold conditions.
In addition, the S&P is making intermediate term bear divergence with the RSI(14) momentum indicator as well as with the McClellan volume oscillator.
Finally, note the March 9 close of 676.53 * 1.618 = 1094.6. Thus, we have completed a Fibonacci retracement.
Look for a topping pattern in the next day or two, followed by a ~15% correction culminating in November. My preferred trading vehicle to take advantage of this correction is SDS, the double inverse S&P ETF.
Showing posts with label RSI. Show all posts
Showing posts with label RSI. Show all posts
Wednesday, October 14, 2009


Thursday, September 3, 2009
$BMY
On Friday 8/28, a Morgan Stanley analyst downgraded Bristol Myers from equal-weight to overweight, and share prices fell 3.92 standard deviations (vs previous 20-days).
There was no bad news. The analyst simply thought the drugmaker's stock was trading at a premium price after recent gains.
To put that price drop into perspective, a 4 standard deviation price move should normally happen once every ~1000 trading years.
Looking at the chart, BMY broke out of a $18.75-$20.50 three month trading range in July, climbing to $23 at the end of August before the Morgan Stanley report.
Now, BMY has fallen back to $21.50 where a former top (and the 50-day EMA at 21.37) is serving as support. The RSI is 45, and still trading in the 40-80 uptrend range. Further, the RSI has made an intermediate positive reversal with the July 20 low -- the price is higher despite a lower RSI value.
 I wouldn't be at all surprised to see BMY at $25+ by or before October.
There was no bad news. The analyst simply thought the drugmaker's stock was trading at a premium price after recent gains.
To put that price drop into perspective, a 4 standard deviation price move should normally happen once every ~1000 trading years.
Looking at the chart, BMY broke out of a $18.75-$20.50 three month trading range in July, climbing to $23 at the end of August before the Morgan Stanley report.
Now, BMY has fallen back to $21.50 where a former top (and the 50-day EMA at 21.37) is serving as support. The RSI is 45, and still trading in the 40-80 uptrend range. Further, the RSI has made an intermediate positive reversal with the July 20 low -- the price is higher despite a lower RSI value.
I wouldn't be at all surprised to see BMY at $25+ by or before October.
Thursday, July 23, 2009
$TBT Trade in Multiple Time Frames
Here's the daily chart for today's TBT swing trade:
 Note price broke through resistance today in the direction of the main uptrend. At the same time, RSI broke through bearish divergence resistance. Prices often accelerate upwards when RSI bear divergence lines fail.
Last week we saw price make a long term positive reversal with the RSI on the daily chart while the RSI made long term bullish divergence support (see the red lines). That would have been an excellent entry point, and supports the long term trend analysis for this trade.
Dialing down to the 30-minute chart, after seeing price break through an old failed support line on the 30-minute chart and the RSI break through bearish divergence resistance, I decided to stalk entry on the 5-minute chart:

I waited for the Force Index(2) to go negative on the 5-minute chart, and trailed a buy stop which got executed at $53.20:
 It didn't take long for the trade to turn positive. I moved stops to break even with an hour left in the day. Now we're free-rolling.
I will trail a fairly loose stop and watch TBT closely for signs of trend exhaustion at or near 4 Average True Ranges from its 50EMA [Keltner Channel (50, 4, 25)] at which point I will take partial profits and tighten my trailing stop.
 Note price broke through resistance today in the direction of the main uptrend. At the same time, RSI broke through bearish divergence resistance. Prices often accelerate upwards when RSI bear divergence lines fail.
Last week we saw price make a long term positive reversal with the RSI on the daily chart while the RSI made long term bullish divergence support (see the red lines). That would have been an excellent entry point, and supports the long term trend analysis for this trade.
Dialing down to the 30-minute chart, after seeing price break through an old failed support line on the 30-minute chart and the RSI break through bearish divergence resistance, I decided to stalk entry on the 5-minute chart:

I waited for the Force Index(2) to go negative on the 5-minute chart, and trailed a buy stop which got executed at $53.20:
 It didn't take long for the trade to turn positive. I moved stops to break even with an hour left in the day. Now we're free-rolling.
I will trail a fairly loose stop and watch TBT closely for signs of trend exhaustion at or near 4 Average True Ranges from its 50EMA [Keltner Channel (50, 4, 25)] at which point I will take partial profits and tighten my trailing stop.
Tuesday, July 14, 2009
$$ Poised for Breakout?
As seen in the chart below, $GDX is on the verge of testing an old RSI bear divergence line. Often when bear divergence lines fail, price can accelerate upwards.
In addition, $GDX has completed a 5-point Wolfe Wave bullish descending wedge and has started to move upwards. As explained in the chart, the Wolfe Wave has both a price and time target. Price is forecast to hit the 1-4 line about the time the 1-3 and 2-4 lines bisect.
In other words, if the RSI bear divergence line fails, I would not be surprised if $GDX goes to ~$43 by ~end of next week in accordance with the Wolfe Wave.

For more chart analysis, see my Public Chart List at Stockcharts.
In addition, $GDX has completed a 5-point Wolfe Wave bullish descending wedge and has started to move upwards. As explained in the chart, the Wolfe Wave has both a price and time target. Price is forecast to hit the 1-4 line about the time the 1-3 and 2-4 lines bisect.
In other words, if the RSI bear divergence line fails, I would not be surprised if $GDX goes to ~$43 by ~end of next week in accordance with the Wolfe Wave.

For more chart analysis, see my Public Chart List at Stockcharts.
Saturday, July 11, 2009
$$ Anti-Chick = The Dude
With a hat tip to The Big Lebowski, The Dude combines features from Linda Raschke’s “Anti” system, and “Chick” Goslin’s 3-point system (with a sprinkle of Andrew Cardwell's RSI methodology).
The elements of The Dude are:
Trend Line = 50-day simple moving average
Confirming Line = 10%D stochastic line
Timing Line = 7%K stochastic line and/or SMA3 of RSI3
In addition, Positive and Negative Reversals on the RSI(14) are incorporated. Courtesy of Mr. Cardwell, Positive Reversals occur when, despite greater downward momentum on a pullback during an uptrend, price cannot make a lower low compared to a prior correction. Negative Reversals occur in downtrends when, despite a higher high in the RSI(14), price cannot rally to a higher high compared to a prior downtrend rally.
Here’s how the chart looks with some explanations and an example of a Positive Reversal:

When the Timing Line (which is short term momentum) starts to change direction, an entry signal in the new Timing Line direction is given in three cases:
1. The Trend Line is pointing the same direction, AND
3. Regardless of the Trend Line direction, entry is signaled when the Timing Line turns up (down), AND
The elements of The Dude are:
Trend Line = 50-day simple moving average
Confirming Line = 10%D stochastic line
Timing Line = 7%K stochastic line and/or SMA3 of RSI3
In addition, Positive and Negative Reversals on the RSI(14) are incorporated. Courtesy of Mr. Cardwell, Positive Reversals occur when, despite greater downward momentum on a pullback during an uptrend, price cannot make a lower low compared to a prior correction. Negative Reversals occur in downtrends when, despite a higher high in the RSI(14), price cannot rally to a higher high compared to a prior downtrend rally.
Here’s how the chart looks with some explanations and an example of a Positive Reversal:

When the Timing Line (which is short term momentum) starts to change direction, an entry signal in the new Timing Line direction is given in three cases:
1. The Trend Line is pointing the same direction, AND
- The Confirming Line is sloping in the same direction as the Trend Line, OR
- Regardless of its direction, the Confirming Line's location is above 60 for new buy signals or below 40 for new sell signals.
3. Regardless of the Trend Line direction, entry is signaled when the Timing Line turns up (down), AND
- The Confirming Line stands above 60 (below 40), AND
- The Confirming Line points in the same direction of the new Timing Line direction.
Thursday, July 9, 2009
$$ Buying Day: Friday July 10
$TBT, $OIH, $UNG, $RKH, $EWZ, $MDY, $GDX, $ICF and $SMH are all deeply oversold on the daily SMA3 RSI3 in the face of rising or flat 50-day moving averages. Consider the Momentum Pinball strategy discussed below -- from the long side.
$$ Shorting Day: Friday 7/10
$DTO, $SKF, $EEV, $SDS, $SRS, $QID and $VXX are all significantly overbought on the daily SMA3 RSI3 in the face of declining 50-day moving averages. On Friday, consider the Momentum Pinball strategy discussed below -- from the short side.
Wednesday, July 8, 2009
$$ Momentum Pinball Variant
Raschke and Connors wrote about their "Momentum Pinball" set up in Street Smarts. They wrote that traders look for a "buying day" when the 3 day RSI drops below 30, and for a "shorting day" when the 3 day RSI rises above 70. On a buying day, you set a buy stop order above the high of the first hour's range. If executed, you place a stop loss order at the low of the first hour's range. If the trade closes the day with a profit, carry overnight and look to exit on a morning follow-through. Exit for sure by the close of the 2nd day of the trade.
I have altered the set up slightly for my personal use. As seen below, I use a 3 day SMA of the 3 day RSI as taught me by Andrew Cardwell. This smooths out the RSI. But I only look for oversold signals during uptrends, and overbought signals in downtrends. I always prefer to enter in the direction of the main trend.
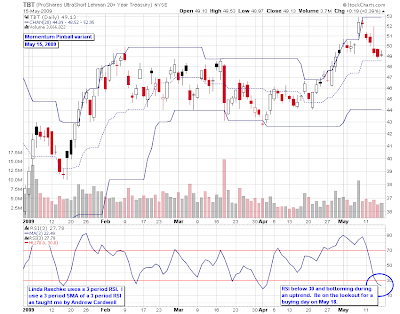
The TBT chart shows that on May 15, 2009 , the SMA3 of RSI 3 was below 30 and bottoming. This was a clue to look for a "buying day" on May 18. Here's the 30-minute chart of TBT for the following week:

A buy stop order was placed at $49.60. Once executed, a stop loss order was placed at $49.05. The trade ended the day profitably, was held overnight, and was sold after a morning follow through on May 19 at $51.00 for a profit of 2.55 x risk.
I have altered the set up slightly for my personal use. As seen below, I use a 3 day SMA of the 3 day RSI as taught me by Andrew Cardwell. This smooths out the RSI. But I only look for oversold signals during uptrends, and overbought signals in downtrends. I always prefer to enter in the direction of the main trend.

The TBT chart shows that on May 15, 2009 , the SMA3 of RSI 3 was below 30 and bottoming. This was a clue to look for a "buying day" on May 18. Here's the 30-minute chart of TBT for the following week:

A buy stop order was placed at $49.60. Once executed, a stop loss order was placed at $49.05. The trade ended the day profitably, was held overnight, and was sold after a morning follow through on May 19 at $51.00 for a profit of 2.55 x risk.
Sunday, July 5, 2009
$$ What is Overbought & Oversold?
Hint: It's not RSI 70 and 30. In fact, an RSI tag of 70 or 30 is meaningless.
John Bollinger wrote at p. 170 of Bollinger on Bollinger Bands that during uptrends, the 14-day RSI oscillates between 80 and 40 while during downtrends RSI(14) ranges between 60 and 20.
Constance Brown explored these RSI(14) range rules more in depth in Chapter 1 of her book Technical Analysis for the Trading Professional.
Both Bollinger and Brown cite Andrew Cardwell's work on the RSI. Andrew has not published, but Steven Vincent of BullBear recently interviewed Andrew for an hour at the June Trader Expo in LA. The interview is broken into six 10 minute segments on YouTube. Here is Part 1 of 6 of the interview. You'll find Parts 2-6 at YouTube.
John Bollinger wrote at p. 170 of Bollinger on Bollinger Bands that during uptrends, the 14-day RSI oscillates between 80 and 40 while during downtrends RSI(14) ranges between 60 and 20.
Constance Brown explored these RSI(14) range rules more in depth in Chapter 1 of her book Technical Analysis for the Trading Professional.
Both Bollinger and Brown cite Andrew Cardwell's work on the RSI. Andrew has not published, but Steven Vincent of BullBear recently interviewed Andrew for an hour at the June Trader Expo in LA. The interview is broken into six 10 minute segments on YouTube. Here is Part 1 of 6 of the interview. You'll find Parts 2-6 at YouTube.
Subscribe to:
Posts (Atom)


 Posts


