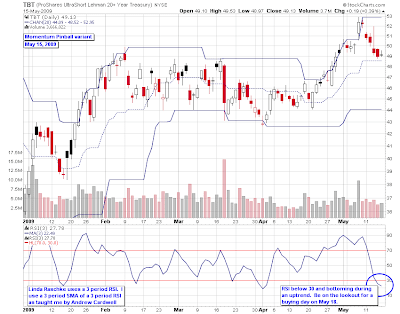
I have altered the set up slightly for my personal use. As seen below, I use a 3 day SMA of the 3 day RSI as taught me by Andrew Cardwell. This smooths out the RSI. But I only look for oversold signals during uptrends, and overbought signals in downtrends. I always prefer to enter in the direction of the main trend.

The TBT chart shows that on May 15, 2009 , the SMA3 of RSI 3 was below 30 and bottoming. This was a clue to look for a "buying day" on May 18. Here's the 30-minute chart of TBT for the following week:

A buy stop order was placed at $49.60. Once executed, a stop loss order was placed at $49.05. The trade ended the day profitably, was held overnight, and was sold after a morning follow through on May 19 at $51.00 for a profit of 2.55 x risk.


No comments:
Post a Comment