Kind Words from Terry Laundry, Founder of T Theory

"Parker has sent me what I consider to be the most important refinements to T Theory I have ever received from anyone in an e-mail . . . which he calls Tweaking the 13th Advance Decline T." September 29, 2010

"Parker has sent me a very interesting concept which is the NY Advance Decline line divided by the put-call ratio . . . What he's done is introduce the idea of sentiment." September 15, 2010

"Parker discovered the Money Flow Ts . . . This is something like the Holy Grail in T Theory. You are always looking for something that will help you refine the peak date." October 17, 201

"Money Flow Ts are probably the greatest new thing I have seen in 20 years in terms of time symmetries."
December 5, 2010.
Showing posts with label Terry Laundy. Show all posts

Friday, June 11, 2010

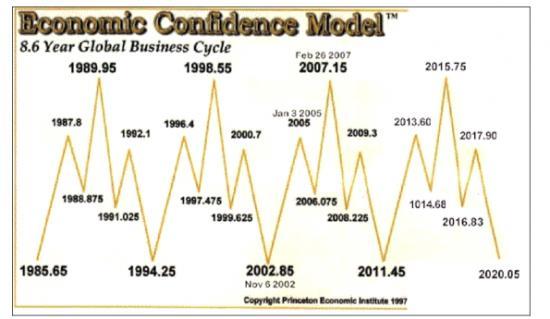
$$ Martin Armstrong's Economic Confidence Cycle

On Monday, June 13, 2011 (2011.45), one year from tomorrow, Martin Armstrong's economic confidence model predicts an 8.6 year cycle low in economic confidence:


If Armstrong is right, in all likelihood risk appetite will be very low a year from now, and safe haven assets will experience a peak.

Note that Terry Laundry's Confidence Index experienced an important low in 2002, and an important high in 2007.  Not exactly the same dates that Martin Armstrong projected in 2002 and 2007, but close.

Note also that the Aden Sisters 8 & 11 year gold cycle chart projects an 11 year cycle high in gold in ~2011-12, an 8 year cycle low in ~2015-16, and another 11 year cycle high in ~2019-2020.  These dates generally line up with Armstrong's calls for tops and bottoms in economic confidence over the next decade.

Monday, May 31, 2010

$SPY - Head & Shoulders Pattern Forming?

As indicated in the chart below, the put-call ratio is overly bearish which sets up nicely for a rally in the S&P.  In addition, several other indicators show that we might be due for a rally.


If we get a rally over the next several weeks, I'll be watching how the S&P interacts with the 1150-1170 levels of former support and resistance, as well as the 50-day moving average (currently at 1163).  Should the S&P fail to break through these levels and start to retreat, it will form the right shoulder of a head and shoulders topping pattern, which would be immensely bearish.

If it forms, this right shoulder should complete well ahead of Terry Laundry's August 26 projected top date.

Tuesday, May 4, 2010

$$ Fibonacci in the S&P

The S&P made an all-time high on October 11, 2007 at 1577. The October 2007 high close was 1565. On March 6, 2009, the S&P bottomed at 667 with a low close of 677 on March 9, 2009.

A 61.8% retracement of 1577 to 667 is 1229. 61.8% of 1565 to 677 is 1226.

We recently reached a high of 1220 in the S&P on April 26, 2010, and a high close of 1217 on April 23, both of which are spitting distance from completing the 61.8% retracement.

For several months, Terry Laundry has forecast a May 20, 2010 interim top in the stock market, followed by a decline into June, and a subsequent final rally to August 26 to conclude the upswing that began in March of 2009.

Today, the S&P closed down at 1174. With May 20th only 12 trading days away, it's looking like if Terry's May 20 forecast is accurate at all, the best we can probably hope for is double top (compared to the late April peak) or a token new high at the Fibonacci 1225-1230 level.

Sunday, May 2, 2010

$$ Terry Laundry's Commentary on My Charts

Terry Laundry of T Theory Observations discusses his confidence indicator, how it compares to the Barron's confidence indicator, and my charts showing fundamental divergence between confidence and stock prices at tops and bottoms.

Wednesday, April 28, 2010

$GLD - 8 and 11 Year Cycles in Gold

The Aden Sisters have published a very interesting gold chart. The chart shows important lows occurring every 7 to 8.5 years since December 1969. The fascinating thing is that in all cases except one, gold rallied to a significant peak ~11 years after each 8 year low.

Should gold continue to follow this pattern, we'll see an important peak in gold in ~2011-12, followed by an important low in ~2016, with another major peak in ~2019.

The ~2019 projection of a major top is intriguing because Terry Laundry writes about 20 year gold cycles, and forecasts the current gold bull trend to end in ~2020.

Terry also suggests that ~2016 could be the 40 year cycle low in stocks.  If there's a huge sell off in equities, gold could go down for the ride.  See the summer and fall of 2008.

Tuesday, April 27, 2010

$$ Terry Laundry publishes my charts!

Very honored to have Terry Laundry of T Theory Observations publish two of the charts I made of his Confidence Indicator showing divergence at the last major top and bottom in the S&P. He'll be discussing my charts and his Confidence Indicator more in depth this weekend.

Sunday, April 25, 2010

$$ Confidence Indicator

Terry Laundry's T-Theory Confidence Indicator is the ratio of the price of a Fidelity junk bond fund (FAGIX) divided by the price of a Vanguard long term treasury fund (VUSTX). The theory is when confidence rises, money flows from the safer investment to the riskier investment, and therefore the ratio rises. When confidence falls, money flows from risk to safety, and the ratio falls. The concept is similar to Barron's Confidence Index which has been around for decades, but Terry thinks his indicator is better, and I agree.

As it turns out, following what the bond investors are doing is a nice leading indicator of turning points at stock market tops and bottoms. Here are links to charts showing pretty dramatic divergence between the T-Theory Confidence Indicator and the S&P at important tops and bottoms over the last 10 years:

2000 Top

2002-03 Bottom

2007 Top

2009 Bottom

Monday, July 27, 2009

$$ Magic T Theory

Terry Laundry projects a " short range T" (interim stock market peak) ending on October 15, 2009 with the " long range T" (ultimate top) ending on August 26, 2010.

He says the fear experienced in the March of 2009 low should be reflected symmetrically by euphoria at the top in late Summer 2010. After the projected Summer 2010 peak, he expects a major down cycle testing and perhaps exceeding the March 2009 low.

Monday, July 20, 2009

$$ Magic T Theory

Terry Laundry's theory (made famous by Buzzy Schwartz) calls for stock market bull through Aug. 2010. Listen to his latest comments.