In the summer of 2005, gold began its run from $418 to $725, while the summer of 2007 saw gold start its run from $657 to $1011. We are now in the summer of 2009. Can we learn anything from studying the past two gold runs?
We'll see. Here's some similarities between 2005 and 2007:
1. The 2005 gold bull started July 18. It kicked off with a 10 winning weeks in 12, gaining 13% over those 12 weeks. The 2007 gold bull began on August 20 with 11 winning weeks in 12, gaining 26% over that initial thrust.
2. The 2005 gold bull experienced a 4-week basing period from early October through early November. The 2007 gold bull, which climbed faster earlier, "rested" for 5 weeks during mid-November through mid-December.
3. After these resting periods, both gold bulls went on 4-5 week runs gaining ~14%.
After that, the similarities end. The 2007 gold bull then experienced another 5-week basing period before a final push to $1011, gaining 11% over a final 4-week thrust ending in mid-March 2008.
The 2005 gold bull had a nice 4-week run starting at Christmas gaining 12%, then had a prolonged 8-week resting period from late-January to mid-March 2006 before a spectacular final 7-week push in which gold gained 30% by mid-May 2006. It's no coincidence that the longer basing period resulted in a big finish.
The post-2000 high for gold going into the 2005 run was $454. Gold made a new high for the new millennium during week 9 of the initial 2005 thrust. Going into the 2007 run, the post-2000 high was $725 which gold surpassed during week 5 of the first 12-week leg.
If we have started a new gold bull, it began on July 13, 2009. Thanks to a magnificent rally today, we have now experienced 3 winning weeks in a row ($913 on 7/10 to $937 on 7/17, $951 on 7/24 and $954 on 7/31) where gold has gained a total of 4.5%.
If history holds, gold will continue to rise through early-October with an expected setback week or two mixed in. The initial thrust should find gold topping between $1030 to $1140 and surpassing its all-time high close of $1011 sometime in mid-August to mid-September.
Then there will be a month-long basing period before another 4-5 week run that will take us into January. After another resting period, we'll be ready for the final leg.
Note that if the first 12-week thrust results in relatively small gains (less than 15%), then under the Elliott Wave alternation principal we should expect the final push to be significantly larger. See the 2005 structure (13% first wave, 30% last wave). On the other hand, if the initial push is large (over 25%), then we should expect the final thrust to be relatively smaller. See the 2007 structure (26% first wave, 11% last wave).
As for where gold eventually tops in the Spring of 2010, the inverted Head & Shoulders pattern projects a top of $1379, while $1357 is a 360 degree turn on the Gann Square of 9 from $1011.
It will be interesting to see whether we are in the midst of a new gold bull run, and if so, how it will unfold in comparison to prior bulls.
PS I should note that according to Alf Field, the 2005 and 2007 gold runs were Waves 3 and 5 of Major Wave One which took gold from $256 to $1011. If we are beginning a new up Wave, it will be Wave 1 (or 3) of Major Wave Three, and might well behave differently than did Waves 3 and 5 in Major Wave One.
Friday, July 31, 2009
Monday, July 27, 2009
$$ Magic T Theory
Terry Laundry projects a " short range T" (interim stock market peak) ending on October 15, 2009 with the " long range T" (ultimate top) ending on August 26, 2010.
He says the fear experienced in the March of 2009 low should be reflected symmetrically by euphoria at the top in late Summer 2010. After the projected Summer 2010 peak, he expects a major down cycle testing and perhaps exceeding the March 2009 low.
Thursday, July 23, 2009
$TBT Trade in Multiple Time Frames
Here's the daily chart for today's TBT swing trade:
Note price broke through resistance today in the direction of the main uptrend. At the same time, RSI broke through bearish divergence resistance. Prices often accelerate upwards when RSI bear divergence lines fail.
Last week we saw price make a long term positive reversal with the RSI on the daily chart while the RSI made long term bullish divergence support (see the red lines). That would have been an excellent entry point, and supports the long term trend analysis for this trade.
Dialing down to the 30-minute chart, after seeing price break through an old failed support line on the 30-minute chart and the RSI break through bearish divergence resistance, I decided to stalk entry on the 5-minute chart:
I waited for the Force Index(2) to go negative on the 5-minute chart, and trailed a buy stop which got executed at $53.20:
It didn't take long for the trade to turn positive. I moved stops to break even with an hour left in the day. Now we're free-rolling.
I will trail a fairly loose stop and watch TBT closely for signs of trend exhaustion at or near 4 Average True Ranges from its 50EMA [Keltner Channel (50, 4, 25)] at which point I will take partial profits and tighten my trailing stop.
Wednesday, July 22, 2009
$$ Trading in Multiple Time Frames
Brian Shannon recently wrote Technical Analysis in Multiple Time Frames. He advocates a minimum of three time frames be studied before committing capital to a trade.
For swing traders he suggests daily charts for long term trend analysis, 30 minute charts to analyze risk-reward, and 5-10 minute charts to fine tune entry. For day traders, he suggests 30 minute charts for long term analysis, 5-10 minute charts as an intermediate time frame, and 1-2 minute charts for fine tuning entries.
Brian's philosophy about time frame correlation is similar to that of Alex Elder who first wrote about his Triple Screen method in Trading for a Living. Elder looked for signals on daily charts that were in sync with the direction of the weekly trend, then used hourly charts to fine tune entries. In his later books, Elder offered tweaks and adjustments to the indicators and settings he used for the Triple Screen, but never varied from his time frame correlation.
Brian categorizes price action into 4 stages: accumulation (Stage 1), markup (Stage 2), distribution (Stage 3), and decline (Stage 4). This analysis is very reminiscent of Stan Weinstein's Secrets to Profiting in Bull and Bear Markets. Weinstein called the four stages: basing area, advancing phase, top area, and declining phase.
For long trades, Brian correlates the long and intermediate time frames of choice by insisting on a Stage 2 (i.e. trending) phase in the long term chart, while anticipating entry when the intermediate chart changes from Stage 1 to Stage 2. For short trades, he looks for Stage 4 in the long term chart, and Stage 3 converting to Stage 4 in the intermediate chart.
In other words, Brian tells us to invest with the long term trend when the intermediate chart says that trend is about to resume from a recent correction. Sage advice.
There's a lot more to Brian's book than this general overview. I highly recommend it. For those of you have Brian's book, you might check out the Weinstein and Elder books for more discussion of time frame correlation and the four stages of the price cycle.
Monday, July 20, 2009
$$ Magic T Theory
Terry Laundry's theory (made famous by Buzzy Schwartz) calls for stock market bull through Aug. 2010. Listen to his latest comments.
Tuesday, July 14, 2009
$$ NR7 Update: Weds 7/15
$GDX, $EEV, $OIH, $QID, $SDS, $SMH all had NR7 days on Tues 7/14.
$$ Bull Hook Update: Weds 7/15
$EWZ went "Bull Hook" today, with an open above the prior high, close below the prior close, and a narrower range than than the prior day.
According to Crabel, going long can be profitable the day after a Bull Hook, especially if $EWZ opens lower on Wednesday, but moves quickly to the upside and trades past today's close ($50.05).
$$ Poised for Breakout?
As seen in the chart below, $GDX is on the verge of testing an old RSI bear divergence line. Often when bear divergence lines fail, price can accelerate upwards.
In addition, $GDX has completed a 5-point Wolfe Wave bullish descending wedge and has started to move upwards. As explained in the chart, the Wolfe Wave has both a price and time target. Price is forecast to hit the 1-4 line about the time the 1-3 and 2-4 lines bisect.
In other words, if the RSI bear divergence line fails, I would not be surprised if $GDX goes to ~$43 by ~end of next week in accordance with the Wolfe Wave.
For more chart analysis, see my Public Chart List at Stockcharts.
Monday, July 13, 2009
Sunday, July 12, 2009
Saturday, July 11, 2009
$$ The Dude Update: Mon 7/13
Long: $EWZ, $SMH;
Short: $DTO, $SRS, $QID, $VXX.
For more info and charts, see my Stockcharts Public Chart List.
Short: $DTO, $SRS, $QID, $VXX.
For more info and charts, see my Stockcharts Public Chart List.
$$ Anti-Chick = The Dude
With a hat tip to The Big Lebowski, The Dude combines features from Linda Raschke’s “Anti” system, and “Chick” Goslin’s 3-point system (with a sprinkle of Andrew Cardwell's RSI methodology).
The elements of The Dude are:
Trend Line = 50-day simple moving average
Confirming Line = 10%D stochastic line
Timing Line = 7%K stochastic line and/or SMA3 of RSI3
In addition, Positive and Negative Reversals on the RSI(14) are incorporated. Courtesy of Mr. Cardwell, Positive Reversals occur when, despite greater downward momentum on a pullback during an uptrend, price cannot make a lower low compared to a prior correction. Negative Reversals occur in downtrends when, despite a higher high in the RSI(14), price cannot rally to a higher high compared to a prior downtrend rally.
Here’s how the chart looks with some explanations and an example of a Positive Reversal:
When the Timing Line (which is short term momentum) starts to change direction, an entry signal in the new Timing Line direction is given in three cases:
1. The Trend Line is pointing the same direction, AND
3. Regardless of the Trend Line direction, entry is signaled when the Timing Line turns up (down), AND
The elements of The Dude are:
Trend Line = 50-day simple moving average
Confirming Line = 10%D stochastic line
Timing Line = 7%K stochastic line and/or SMA3 of RSI3
In addition, Positive and Negative Reversals on the RSI(14) are incorporated. Courtesy of Mr. Cardwell, Positive Reversals occur when, despite greater downward momentum on a pullback during an uptrend, price cannot make a lower low compared to a prior correction. Negative Reversals occur in downtrends when, despite a higher high in the RSI(14), price cannot rally to a higher high compared to a prior downtrend rally.
Here’s how the chart looks with some explanations and an example of a Positive Reversal:
When the Timing Line (which is short term momentum) starts to change direction, an entry signal in the new Timing Line direction is given in three cases:
1. The Trend Line is pointing the same direction, AND
- The Confirming Line is sloping in the same direction as the Trend Line, OR
- Regardless of its direction, the Confirming Line's location is above 60 for new buy signals or below 40 for new sell signals.
3. Regardless of the Trend Line direction, entry is signaled when the Timing Line turns up (down), AND
- The Confirming Line stands above 60 (below 40), AND
- The Confirming Line points in the same direction of the new Timing Line direction.
$$ My Stockcharts Public Chart List
For daily charts of the ETFs I follow, please see my Public Chart List at Stockcharts. For reference, I have included a permanent link to the right just above my Twitter updates.
Friday, July 10, 2009
$$ Expectancy and Trade Comparison
Expectancy is simply R per trade (sum of R for all trades/# of trades).
A few posts back, we talked about how the stop loss placement affects position size, R-Multiples, and trade win percentage. The example was a $30 stock with a $32 target. The 30-cent stop resulted in a 6.67R profit, while the $1 stop resulted in a 2R profit.
I compare these two trades as follows.
First I want to know break even percentage trade win percentage. For the 30 cent stop, break even trade win percentage is 1/7.7 = 13%. For the $1 stop, it is 1/3 = 33%. These trade win percentages result in an expectancy of 0R per trade.
Second, I want to know the trade win percentage for the higher R-Multiple trade that would equal the max expectancy of the lower R-multiple trade. For the 2R trade, max expectancy is 2R (if you were right 100% of the time). To average 2R per trade with the 30 cent stop, you'd need to be right 39% of the time. [(3.9 *6.67) - 6.1 = 20R over 10 trades or 2R per trade].
Clearly, if I get the 30 cent stop trade right more than 39% of the time, it's always better to take that trade. But to fairly compare the trades, find the midpoint. Being right 67% of the time on the $1 stop trade = being right 26% of the time on the 30 cent stop trade. Both would have an expectancy of 1R per trade.
Finally, I decide whether I feel more confident hitting the 6.67R trade 26% of the time, or the 2R trade 67% of the time.
Drawdown is another consideration. But that is for another post.
$$ Inside Day/NR4
Yesterday, $EWZ, $ICF, $MDY and $SRS went ID/NR4 on the daily chart. Range contraction often precedes range expansion. Today could be volatile in either direction for these ETFs.
Toby Crabel popularized the Inside Day/Narrow Range of the Last 4 Days volatility breakout in his book Day Trading with Short Term Price Patterns and Opening Range Breakout.
He also wrote an 8-part magazine series on the subject for Stocks and Commodities.
Toby Crabel popularized the Inside Day/Narrow Range of the Last 4 Days volatility breakout in his book Day Trading with Short Term Price Patterns and Opening Range Breakout.
He also wrote an 8-part magazine series on the subject for Stocks and Commodities.
Thursday, July 9, 2009
$$ Buying Day: Friday July 10
$TBT, $OIH, $UNG, $RKH, $EWZ, $MDY, $GDX, $ICF and $SMH are all deeply oversold on the daily SMA3 RSI3 in the face of rising or flat 50-day moving averages. Consider the Momentum Pinball strategy discussed below -- from the long side.
$$ Shorting Day: Friday 7/10
$DTO, $SKF, $EEV, $SDS, $SRS, $QID and $VXX are all significantly overbought on the daily SMA3 RSI3 in the face of declining 50-day moving averages. On Friday, consider the Momentum Pinball strategy discussed below -- from the short side.
$$ Relationship Between Position Sizing, R-Multiples and Trade Win %
For the swing/day trader, all three concepts are interrelated. The common denominator is how far away you place your initial stop loss.
Assume you risk 1% of account per trade. Assume account value is $100K. If you enter at $30 with a $29.70 stop loss and a $32 target, your risk is $1000, your position size will be (1000/.3) = 3333 shares * $30 = $100K or 100% of your account value in the trade.
If you hit your target at $32, you make $2/share or $6666. Your R-Multiple is 6.67R.
Of course, your stop at $29.70 is fairly tight, and you will be stopped out more often than with a looser stop, say $29 even. The tighter your stop, the greater the negative impact on your trade win percentage and vice versa.
If you made the same trade with a $29 stop, risking $1 a share, your position size would be 1000/1 = 1000 shares *$30 = $30K or 30% of your account value.
If you hit your target at $32, you make $2/share or $2000. Your R-Multiple is 2.0R.
To compensate for the lower R-Multiple, you will hit your target more often than you would with a $29.70 stop loss.
Bottom line, for the short term trader there is an art to placing your initial stop loss which directly affects how many shares you buy per unit of risk, what your R-Multiple reward will be compared to your risk, and how often your trade will be successful.
In a future post, I'll discuss how to compare the mathematical expectancy of the two trades outlined above.
Wednesday, July 8, 2009
$$ Momentum Pinball Variant
Raschke and Connors wrote about their "Momentum Pinball" set up in Street Smarts. They wrote that traders look for a "buying day" when the 3 day RSI drops below 30, and for a "shorting day" when the 3 day RSI rises above 70. On a buying day, you set a buy stop order above the high of the first hour's range. If executed, you place a stop loss order at the low of the first hour's range. If the trade closes the day with a profit, carry overnight and look to exit on a morning follow-through. Exit for sure by the close of the 2nd day of the trade.
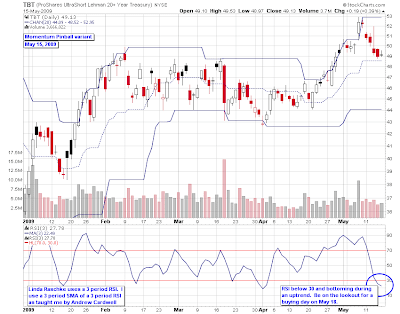
I have altered the set up slightly for my personal use. As seen below, I use a 3 day SMA of the 3 day RSI as taught me by Andrew Cardwell. This smooths out the RSI. But I only look for oversold signals during uptrends, and overbought signals in downtrends. I always prefer to enter in the direction of the main trend.
The TBT chart shows that on May 15, 2009 , the SMA3 of RSI 3 was below 30 and bottoming. This was a clue to look for a "buying day" on May 18. Here's the 30-minute chart of TBT for the following week:
A buy stop order was placed at $49.60. Once executed, a stop loss order was placed at $49.05. The trade ended the day profitably, was held overnight, and was sold after a morning follow through on May 19 at $51.00 for a profit of 2.55 x risk.
Tuesday, July 7, 2009
$$ R-Multiples
The term R-Multiple was coined by Van Tharp. I first read about it in his book Trade Your Way to Financial Freedom. He treated the subject in depth in Chapter 5 of his book Financial Freedom Through Electronic Day Trading.
R-Multiple simply refers to the "reward" part of your reward-to-risk ratio. If you risk 1R per trade, most traders usually want at least 2R if not 3R or more in potential reward for their risk. In my trading, I consider a 5R+ return on a trade to be a "high R-Multiple."
In future posts, I will discuss the interrelationship between position sizing, trade win percentage, and R-Multiples.
Monday, July 6, 2009
$$ Managing Risk
Lessons from Jack Schwager's Market Wizard series:
Paul Tudor Jones
"Never play macho man with the market. My major problem was that I was trading far too many contracts relative to the equity in the accounts I handled. My accounts lost something like 60 to 70% of their equity in a single trade.
Risk control is the most important thing in trading. My guiding philosophy is playing great defense, not great offense. Now, I want to make sure I never have a 10% loss in any month."
Bruce Kovner
"Risk management is the most important thing to understand. Whatever you think your position should be, cut it in half. My experience with novice traders is that they trade 5 times too big. They are taking 5-10% risks on a trade when they should be risking 1-2%.
A greedy trader always blows out. I know some really inspired traders who never seemed to keep the money they made. One always struck me as a brilliant trader. Intellectually, he knew the markets better than I did, yet I was keeping money and he was not. Where was he going wrong? Position size. He traded much too big. For every one contract I traded, he traded ten. He would double his money on two separate occasions each year, but still end up flat."
Ed Seykota
"The three elements of good trading are: (1) cutting losses, (2) cutting losses, and (3) cutting losses. Keep bets small."
Larry Hite
"The very first rule we live by is: Never risk more than 1% of total equity on any trade. Keeping risk small and constant is absolutely critical. For example, one manager I know had a large account withdraw half the money in the account. Instead of cutting his position size in half, the manager kept trading the same number of contracts. Eventually, half the original money became 10% of the original money. Risk is a no-fooling around game; it does not allow for mistakes. If you do not manage risk, eventually they will carry you out."
*****************
I define risk (R) as the amount of money I will lose if a trade goes against me and I get stopped out. I accept the fact that: 1) there will often be slippage with stop-market orders, and 2) occasionally price will gap through my stop.
Currently, R is a standard sum less than 1% of account value. I risk the same amount of money on each trade.
Sunday, July 5, 2009
$$ What is Overbought & Oversold?
Hint: It's not RSI 70 and 30. In fact, an RSI tag of 70 or 30 is meaningless.
John Bollinger wrote at p. 170 of Bollinger on Bollinger Bands that during uptrends, the 14-day RSI oscillates between 80 and 40 while during downtrends RSI(14) ranges between 60 and 20.
Constance Brown explored these RSI(14) range rules more in depth in Chapter 1 of her book Technical Analysis for the Trading Professional.
Both Bollinger and Brown cite Andrew Cardwell's work on the RSI. Andrew has not published, but Steven Vincent of BullBear recently interviewed Andrew for an hour at the June Trader Expo in LA. The interview is broken into six 10 minute segments on YouTube. Here is Part 1 of 6 of the interview. You'll find Parts 2-6 at YouTube.
Subscribe to:
Posts (Atom)