Kind Words from Terry Laundry, Founder of T Theory

"Parker has sent me what I consider to be the most important refinements to T Theory I have ever received from anyone in an e-mail . . . which he calls Tweaking the 13th Advance Decline T." September 29, 2010

"Parker has sent me a very interesting concept which is the NY Advance Decline line divided by the put-call ratio . . . What he's done is introduce the idea of sentiment." September 15, 2010

"Parker discovered the Money Flow Ts . . . This is something like the Holy Grail in T Theory. You are always looking for something that will help you refine the peak date." October 17, 201

"Money Flow Ts are probably the greatest new thing I have seen in 20 years in terms of time symmetries."
December 5, 2010.

Friday, April 30, 2010

$GLD - Danger territory?

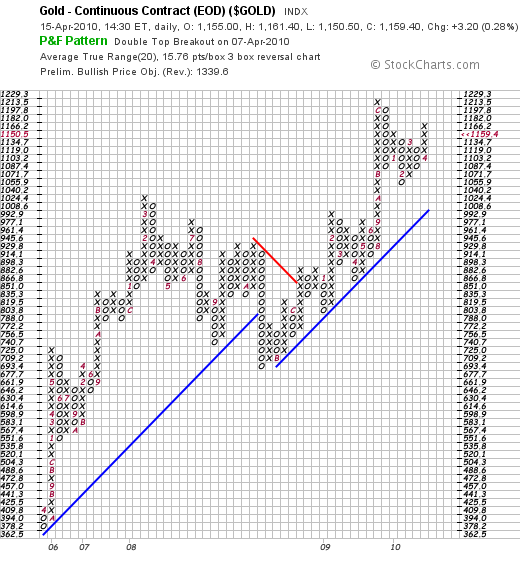
Let's examine the action in gold in 2008. From the March 18 peak, we saw a 175 point correction, followed by a Fibonacci 78.6% retracement, followed by a total breakdown in the precious metal:


We may be seeing a similar scenario play out in 2009-10. From the December 3, 2009 peak, we saw a 180 point correction, followed by a retracement that is nearly 78.6%. Today, gold closed at $1179, and it needs to hit $1186 to complete hit the Fibonacci 78.6% level:


As a trader, we've hit a low risk area to take some profits and tighten some stop losses. If gold breaks down again, we've captured nearly all the profit to be had in the $100 run since late March. If gold continues its rise past 1200, we can get back in feeling fairly confident we're past the danger zone and gold is headed to new all-time highs.

Wednesday, April 28, 2010

$GLD - 8 and 11 Year Cycles in Gold

The Aden Sisters have published a very interesting gold chart. The chart shows important lows occurring every 7 to 8.5 years since December 1969. The fascinating thing is that in all cases except one, gold rallied to a significant peak ~11 years after each 8 year low.

Should gold continue to follow this pattern, we'll see an important peak in gold in ~2011-12, followed by an important low in ~2016, with another major peak in ~2019.

The ~2019 projection of a major top is intriguing because Terry Laundry writes about 20 year gold cycles, and forecasts the current gold bull trend to end in ~2020.

Terry also suggests that ~2016 could be the 40 year cycle low in stocks.  If there's a huge sell off in equities, gold could go down for the ride.  See the summer and fall of 2008.

Tuesday, April 27, 2010

$$ Terry Laundry publishes my charts!

Very honored to have Terry Laundry of T Theory Observations publish two of the charts I made of his Confidence Indicator showing divergence at the last major top and bottom in the S&P. He'll be discussing my charts and his Confidence Indicator more in depth this weekend.

Sunday, April 25, 2010

$$ Confidence Indicator

Terry Laundry's T-Theory Confidence Indicator is the ratio of the price of a Fidelity junk bond fund (FAGIX) divided by the price of a Vanguard long term treasury fund (VUSTX). The theory is when confidence rises, money flows from the safer investment to the riskier investment, and therefore the ratio rises. When confidence falls, money flows from risk to safety, and the ratio falls. The concept is similar to Barron's Confidence Index which has been around for decades, but Terry thinks his indicator is better, and I agree.

As it turns out, following what the bond investors are doing is a nice leading indicator of turning points at stock market tops and bottoms. Here are links to charts showing pretty dramatic divergence between the T-Theory Confidence Indicator and the S&P at important tops and bottoms over the last 10 years:

2000 Top

2002-03 Bottom

2007 Top

2009 Bottom

Friday, April 16, 2010

$GLD - P&F Price Objective

Last week on April 7, 2010 gold saw a double top breakout on the point & figure chart, suggesting a $1339.60 price objective.