Kind Words from Terry Laundry, Founder of T Theory

"Parker has sent me what I consider to be the most important refinements to T Theory I have ever received from anyone in an e-mail . . . which he calls Tweaking the 13th Advance Decline T." September 29, 2010

"Parker has sent me a very interesting concept which is the NY Advance Decline line divided by the put-call ratio . . . What he's done is introduce the idea of sentiment." September 15, 2010

"Parker discovered the Money Flow Ts . . . This is something like the Holy Grail in T Theory. You are always looking for something that will help you refine the peak date." October 17, 201

"Money Flow Ts are probably the greatest new thing I have seen in 20 years in terms of time symmetries."
December 5, 2010.

Tuesday, October 26, 2010

$$ Studying the T Theory Volume Oscillator

Here's how Terry's Volume Oscillator ("VO") looked in the first half of April 2010:

3
1-Apr-10
26
5-Apr-10
29
6-Apr-10
5
7-Apr-10
12
8-Apr-10
25
9-Apr-10
29
12-Apr-10
9
13-Apr-10
39
14-Apr-10
18
15-Apr-10

The VO turned negative on April 16 and stayed negative for five trading sessions as prices continued to rise, tipping off investors that the up trend was losing strength:

-66
16-Apr-10
-54
19-Apr-10
-16
20-Apr-10
-27
21-Apr-10
-17
22-Apr-10

The VO climbed to 0 on April 23, before turning over on April 26 and becoming vastly negative as the rout ensued:

0
23-Apr-10
-19
26-Apr-10
-97
27-Apr-10
-56
28-Apr-10
-11
29-Apr-10
-71
30-Apr-10
-33
3-May-10
-99
4-May-10
-129
5-May-10
-231
6-May-10
-284
7-May-10

Compare how the VO has been behaving recently:

1
4-Oct-10
52
5-Oct-10
38
6-Oct-10
22
7-Oct-10
39
8-Oct-10
27
11-Oct-10
33
12-Oct-10
61
13-Oct-10
27
14-Oct-10
-2
15-Oct-10
17
18-Oct-10

On October 19, the VO turned negative for four trading sessions:

-40
19-Oct-10
-11
20-Oct-10
-18
21-Oct-10
-12
22-Oct-10

The VO climbed back to 0 yesterday, before rolling over to -5 today:

0
25-Oct-10
-5
26-Oct-10


I thought this was an interesting similarity.  We'll see how it plays out.

$$ Coiled Spring

Looks like the S&P is winding up tight in a symmetrical triangle.  Note the convergence of all the various moving averages.  Whichever way the triangle resolves should show us the market direction over the next couple of days.

Monday, October 25, 2010

$$ Dow Theory Confirmation Alert

We are very close to a Dow Theory up trend confirmation.  The reason I point this out is because if we get the confirmation, you can expect some technical buying as well as capitulation of shorts which could produce a steep climb (at least in the short term) in all the indexes.

Strict Dow Theory only uses closing prices, but I will give you both the high and the close.  Here is today's DJIA vs. late April:

Close
11164 today (41 points away)
11205 April

High
11247 today (11 points away)
11258 April

Here is the information for the Dow Transports:

Close
4774.86 today  (31 points away)
4806.01 April

High
4823.98 today (already exceeded April)
4812.86 April

$$ Shooting Stars and Gravestone Dojis

The Dow and the Russell saw shooting star candles today.  A gravestone doji appeared on the Nasdaq.  The S&P was either a shooting star or a gravestone doji, depending on how liberal you are - there was a "real body", but it was tiny. 

On the S&P, price closed near the bottom channel of the rising wedge/Wolfe Wave. 

POMO tomorrow.

$$ Potential Wolfe Wave in Action

Target is the dotted line.  Patten invalidated if price rises back above Point 5.  Note:  Wave 5 is supposed to overshoot the trend line from 1-3.  We'll see how this plays out.


Sunday, October 24, 2010

$$ Ending Patterns

We have two bearish patterns on the S&P 30 minute chart right now, the Megaphone and the Bearish Rising Wedge.  Both patterns would remain valid even if the S&P rose into the low to mid 1190s early next week.  Whenever the S&P violates the lower red boundary of the Rising Wedge may well spark the anticipated correction.  

Thursday, October 21, 2010

$$ Rallies and Suckers

I was watching the 1189 level on October 21 to see if we were going to breakout.  However, the TRIN was well over 1.0 all morning leading into the top at 1189. This indicates distribution. Here's why:

TRIN is the ratio of two ratios. (Advancing issues to Declining issues) to (Advancing volume to Declining volume). So, if you had 1800 advances to 1200 declines but 6M shares of advances to 8M shares of declines, then TRIN would be 1.5/0.75 or 2.0

If a rally is being bought into, you would expect the ratio to be less than 1.0, i.e., volume supporting the move. Here, the ratio was greater than 1.0 all morning and during those 30 minutes the market hovered at 1189, suggesting that the rally was being sold into. Distribution rallies are often sucker rallies and usually offer false breakouts. 

This got me thinking.  Have we seen bearish divergence between the cumulative NYSE Advance-Decline Volume and the S&P at tops recently?  Turns out we have.  Check out the tops in January, April and August:


This bearish divergence at tops is excellent evidence of distribution.  Don't look now, but we have some divergence already in October:


Note:  for whatever reason, bullish divergence between $NYUD and $SPX does not appear very often at bottoms.

Wednesday, October 20, 2010

$$ From the Mailbag

I received a good question today:

"As of 2:30pm on OCT 20th- the market is again relentless in its strength. We are nearing the OCT 18 high in the S&P500 and other markets. Do you foresee any sort of sustainable correction before we reach your NOV 12th peak date? 

Terry's Aug 26 peak date turned into a massive low. Do we face a similar situation come Nov 12th?" 

Let me preface my remarks by saying that on my interpretation of how to calculate T13, November 12 is an end date, not necessarily a peak date.  For example, using the same methodology on T12 produced a mid-December 2007 end date.  That target date was nowhere near the October 2007 price peak, but it was within a week of when the downtrend started in earnest.   Likewise, I believe November 12 will be within several days either way of when the downtrend starts for good.

While this thing can play out many ways, only one of the original three scenarios I am watching is still in play:

"October 13 started a fresh divergence topping process where October 20 may be the middle of the divergence, suggesting a final price top for T13 on or about ~October 27.  From there, there is a short term correction and then a rally that falls short of the October high and fails, leading to a steep decline into the nulled echo low.  Basically, a fractal of what happened in April-May."  Here's how that might look:


Let's examine what's going on.  Here are the highs of the last few days on the S&P:

Oct 13 = 1184.4
Oct 14 = 1178.9
Oct 15 = 1181.2
Oct 18 = 1185.5
Oct 19 = 1178.6
Oct 20 = 1182.9

It's clear that price is still struggling with Gann 180 degree resistance at 1182.4, which has a margin of error of approximately +/-0.5% (5.9 points either way).

On the bottom end, we are making lower lows since October 13.  ~1167 on October 14-15, and 1160 on October 19.  This is a Right Angled Broadening Formation on the 30 minute chart:


Normally, this pattern is bearish.  However, if it breaks through the horizontal resistance zone at 1182-1188, then that's  usually a bullish sign regarding the continuation of the up trend.  If we get one last up leg, it will come on the momentum of breaking this horizontal resistance. 

Tuesday, October 19, 2010

$$ Double Ts


This video examines a peculiar double-time symmetry found at the end of major moves.

Monday, October 18, 2010

$$ More on Gann

I received a good question today in the comments:

Does the break above Oct. 13 on the S&P change your views on a move down into Wednesday...or are we up to 1200 before a short and sharp reversal...in your opinion.

The reader is referring to the fact that the S&P hit 1185.53 intraday today, about a point above the high of 1184.38 on October 13.  He's wondering if this is a break out.  For the record, here are the highs over the last several days:

Mon 18-Oct-2010  1185.5300 
Fri 15-Oct-2010  1181.2000 
Thu 14-Oct-2010  1178.8900 
Wed 13-Oct-2010  1184.3800 
 
Is this a breakout?  The answer is:  maybe!  
 
Let's go back and review the move in the S&P in comparison 
to our expected Gann resistance levels.  
 
We saw a low of 1010.9 in July 1.  From that level, here are 
the initial anticipated Gann resistance levels:

90 degrees:  1096.6
120 degrees:  1125.2
180 degrees:  1182.4

Let's examine the highs from July 13-16:

Fri 16-Jul-2010  1093.8500 
Thu 15-Jul-2010  1098.6600 
Wed 14-Jul-2010  1099.0800 
Tue 13-Jul-2010  1099.4600
 
As you can see, 90 degrees proved strong resistance over 
several days.  
 
From there, the S&P pulled back to 1057 before encountering 
resistance at 120 degrees (1125.2) on the highs from August 2-10:

Tue 10-Aug-2010  1127.1600 
Mon 09-Aug-2010  1129.2400 
Fri 06-Aug-2010  1123.0600 
Thu 05-Aug-2010  1126.5600 
Wed 04-Aug-2010  1128.7500 
Tue 03-Aug-2010  1125.4400 
Mon 02-Aug-2010  1127.3000 
 
As we know, the S&P was rejected from the 1125/120 degree 
level, and bounced all the way back down to 1039 in late August.

However, it made another assault on 120 degrees during the highs 
of September 13-16:
 
Thu 16-Sep-2010  1125.4400 
Wed 15-Sep-2010  1126.4600 
Tue 14-Sep-2010  1127.3600 
Mon 13-Sep-2010  1123.8700
 
This time, the S&P powered through 120 degrees and now is 
wrestling with 180 degrees (1182.4) as shown above.
 
All of which is a long way of saying that I don't think the S&P 
has broken out of 1182/180 degree resistance yet.  It could.  
Or this resistance could hold and we'll see stocks correct.  

$$ ForeclosureGate


Here's an e-mail from David Kotok at Cumberland Advisors (reprinted at Credit Writedowns) that accurately describes the foreclosure mess:

"Homeowners can only be foreclosed and evicted from their homes by the person or institution who actually has the loan paper…only the note-holder has legal standing to ask a court to foreclose and evict. Not the mortgage, the note, which is the actual IOU that people sign, promising to pay back the mortgage loan.

"Before mortgage-backed securities, most mortgage loans were issued by the local savings & loan. So the note usually didn’t go anywhere: it stayed in the offices of the S&L down the street.

"But once mortgage loan securitization happened, things got sloppy…they got sloppy by the very nature of mortgage-backed securities.

"The whole purpose of MBSs was for different investors to have their different risk appetites satiated with different bonds. Some bond customers wanted super-safe bonds with low returns, some others wanted riskier bonds with correspondingly higher rates of return.

"Therefore, as everyone knows, the loans were ‘bundled’ into REMICs (Real-Estate Mortgage Investment Conduits, a special vehicle designed to hold the loans for tax purposes), and then "sliced & diced"…split up and put into tranches, according to their likelihood of default, their interest rates, and other characteristics.

"This slicing and dicing created ‘senior tranches,’ where the loans would likely be paid in full, if the past history of mortgage loan statistics was to be believed. And it also created ‘junior tranches,’ where the loans might well default, again according to past history and statistics. (A whole range of tranches was created, of course, but for the purposes of this discussion we can ignore all those countless other variations.)

"These various tranches were sold to different investors, according to their risk appetite. That’s why some of the MBS bonds were rated as safe as Treasury bonds, and others were rated by the ratings agencies as risky as junk bonds.

"But here’s the key issue: When an MBS was first created, all the mortgages were pristine…none had defaulted yet, because they were all brand-new loans. Statistically, some would default and some others would be paid back in full…but which ones specifically would default? No one knew, of course. If I toss a coin 1,000 times, statistically, 500 tosses the coin will land heads…but what will the result be of, say, the 723rd toss? No one knows.

"Same with mortgages.

"So in fact, it wasn’t that the riskier loans were in junior tranches and the safer ones were in senior tranches: rather, all the loans were in the REMIC, and if and when a mortgage in a given bundle of mortgages defaulted, the junior tranche holders would take the losses first, and the senior tranche holder last.

"But who were the owners of the junior-tranche bond and the senior-tranche bonds? Two different people. Therefore, the mortgage note was not actually signed over to the bond holder. In fact, it couldn’t be signed over. Because, again, since no one knew which mortgage would default first, it was impossible to assign a specific mortgage to a specific bond.

"Therefore, how to make sure the safe mortgage loan stayed with the safe MBS tranche, and the risky and/or defaulting mortgage went to the riskier tranche?

"Enter stage right the famed MERS…the Mortgage Electronic Registration System.

"MERS was the repository of these digitized mortgage notes that the banks originated from the actual mortgage loans signed by homebuyers. MERS was jointly owned by Fannie Mae and Freddie Mac (yes, those two again …I know, I know: like the chlamydia and the gonorrhea of the financial world…you cure ‘em, but they just keep coming back).

"The purpose of MERS was to help in the securitization process. Basically, MERS directed defaulting mortgages to the appropriate tranches of mortgage bonds. MERS was essentially where the digitized mortgage notes were sliced and diced and rearranged so as to create the mortgage-backed securities. Think of MERS as Dr. Frankenstein’s operating table, where the beast got put together.

"However, legally…and this is the important part…MERS didn’t hold any mortgage notes: the true owner of the mortgage notes should have been the REMICs.

"But the REMICs didn’t own the notes either, because of a fluke of the ratings agencies: the REMICs had to be "bankruptcy remote," in order to get the precious ratings needed to peddle mortgage-backed Securities to institutional investors.

"So somewhere between the REMICs and MERS, the chain of title was broken.

"Now, what does ‘broken chain of title’ mean? Simple: when a homebuyer signs a mortgage, the key document is the note. As I said before, it’s the actual IOU. In order for the mortgage note to be sold or transferred to someone else (and therefore turned into a mortgage-backed security), this document has to be physically endorsed to the next person. All of these signatures on the note are called the ‘chain of title.’

"You can endorse the note as many times as you please…but you have to have a clear chain of title right on the actual note: I sold the note to Moe, who sold it to Larry, who sold it to Curly, and all our notarized signatures are actually, physically, on the note, one after the other.

"If for whatever reason any of these signatures is skipped, then the chain of title is said to be broken. Therefore, legally, the mortgage note is no longer valid. That is, the person who took out the mortgage loan to pay for the house no longer owes the loan, because he no longer knows whom to pay.

"To repeat: if the chain of title of the note is broken, then the borrower no longer owes any money on the loan.

"Read that last sentence again, please. Don’t worry, I’ll wait.

"You read it again? Good: Now you see the can of worms that’s opening up.

"The broken chain of title might not have been an issue if there hadn’t been an unusual number of foreclosures. Before the housing bubble collapse, the people who defaulted on their mortgages wouldn’t have bothered to check to see that the paperwork was in order.

"But as everyone knows, following the housing collapse of 2007-’10-and-counting, there has been a boatload of foreclosures…and foreclosures on a lot of people who weren’t sloppy bums who skipped out on their mortgage payments, but smart and cautious people who got squeezed by circumstances.

"These people started contesting their foreclosures and evictions, and so started looking into the chain-of-title issue, and that’s when the paperwork became important. So the chain of title became crucial and the botched paperwork became a nontrivial issue.

"Now, the banks had hired ‘foreclosure mills’…law firms that specialized in foreclosures…in order to handle the massive volume of foreclosures and evictions that occurred because of the housing crisis. The foreclosure mills, as one would expect, were the first to spot the broken chain of titles.

"Well, what do you know, it turns out that these foreclosure mills might have faked and falsified documentation, so as to fraudulently repair the chain-of-title issue, thereby ‘proving’ that the banks had judicial standing to foreclose on delinquent mortgages. These foreclosure mills might have even forged the loan note itself…

"Wait, why am I hedging? The foreclosure mills did actually, deliberately, and categorically fake and falsify documents, in order to expedite these foreclosures and evictions. Yves Smith at Naked Capitalism, who has been all over this story, put up a price list for this ‘service’ from a company called DocX…yes, a price list for forged documents. Talk about your one-stop shopping!

"So in other words, a massive fraud was carried out, with the inevitable innocent bystanders getting caught up in the fraud: the guy who got foreclosed and evicted from his home in Florida, even though he didn’t actually have a mortgage, and in fact owned his house free -and clear. The family that was foreclosed and evicted, even though they had a perfect mortgage payment record. Et cetera, depressing et cetera.

"Now, the reason this all came to light is not because too many people were getting screwed by the banks or the government or someone with some power saw what was going on and decided to put a stop to it…that would have been nice, to see a shining knight in armor, riding on a white horse.

"But that’s not how America works nowadays.

"No, alarm bells started going off when the title insurance companies started to refuse to insure the titles.

"In every sale, a title insurance company insures that the title is free -and clear …that the prospective buyer is in fact buying a properly vetted house, with its title issues all in order. Title insurance companies stopped providing their service because…of course…they didn’t want to expose themselves to the risk that the chain of title had been broken, and that the bank had illegally foreclosed on the previous owner.

"That’s when things started getting interesting: that’s when the attorneys general of various states started snooping around and making noises (elections are coming up, after all).

"The fact that Ally Financial (formerly GMAC), JP Morgan Chase, and now Bank of America have suspended foreclosures signals that this is a serious problem…obviously. Banks that size, with that much exposure to foreclosed properties, don’t suspend foreclosures just because they’re good corporate citizens who want to do the right thing, and who have all their paperwork in strict order…they’re halting their foreclosures for a reason.

"The move by the United States Congress last week, to sneak by the Interstate Recognition of Notarizations Act? That was all the banking lobby. They wanted to shove down that law, so that their foreclosure mills’ forged and fraudulent documents would not be scrutinized by out-of-state judges. (The spineless cowards in the Senate carried out their master’s will by a voice vote…so that there would be no registry of who had voted for it, and therefore no accountability.)

"And President Obama’s pocket veto of the measure? He had to veto it…if he’d signed it, there would have been political hell to pay, plus it would have been challenged almost immediately, and likely overturned as unconstitutional in short order. (But he didn’t have the gumption to come right out and veto it…he pocket vetoed it.)

"As soon as the White House announced the pocket veto…the very next day!…Bank of America halted all foreclosures, nationwide.

"Why do you think that happened? Because the banks are in trouble…again. Over the same thing as last time…the damned mortgage-backed securities!

"The reason the banks are in the tank again is, if they’ve been foreclosing on people they didn’t have the legal right to foreclose on, then those people have the right to get their houses back. And the people who bought those foreclosed houses from the bank might not actually own the houses they paid for.

"And it won’t matter if a particular case…or even most cases…were on the up -and up: It won’t matter if most of the foreclosures and evictions were truly due to the homeowner failing to pay his mortgage. The fraud committed by the foreclosure mills casts enough doubt that, now, all foreclosures come into question. Not only that, all mortgages come into question.

"People still haven’t figured out what all this means. But I’ll tell you: if enough mortgage-paying homeowners realize that they may be able to get out of their mortgage loans and keep their houses, scot-free? That’s basically a license to halt payments right now, thank you. That’s basically a license to tell the banks to take a hike.

"What are the banks going to do…try to foreclose and then evict you? Show me the paper, Mr. Banker, will be all you need to say.

"This is a major, major crisis. The Lehman bankruptcy could be a spring rain compared to this hurricane. And if this isn’t handled right…and handled right quick, in the next couple of weeks at the outside…this crisis could also spell the end of the mortgage business altogether. Of banking altogether. Hell, of civil society. What do you think happens in a country when the citizens realize they don’t need to pay their debts?"

********************
Unfortunately, the foreclosure problem is only one piece of the puzzle.  As disclosed on Parker Spitzer and explained by Mike Shedlock, it appears that the Wall Street banks who securitized these mortgages and sold them to pension funds across America hired a due diligence firm called Clayton.  Clayton discovered that 28% of the mortgages being securitized were at high risk for default.  The Wall Street banks apparently did not disclose this to the investors, and the ratings agencies ignored the due diligence.  

Instead, the trading desks at the Wall Street banks shorted the very mortgage-backed securities they sold to their clients, as Lloyd Blankfein of Goldman testified to Congress.  If they did so based on the due diligence (i.e. inside information) that they did not disclose to investors, the Wall Street banks have serious problems.


Sunday, October 17, 2010

$$ Gann Square of Nine

WD Gann's Square of Nine has always fascinated me. Important support and resistance points often occur at "turns" of 45, 90, 120, 180, 240, 270, 315 and 360 degrees around the Wheel.  

I have built a series of Gann Wheels.  The one I use depends on the price of the security.   My Gann Wheel for securities priced between ~500 and ~1400 shows that 1182.25 is an 180 degree turn from 1013.5. 

The reason I find that interesting is because the S&P bottomed at 1011 on July 1, and the most recent top is 1184 on October 13. In other words, we've hit 180 degree resistance on the Gann Wheel.  We'll see if it holds. 

For reference, 1240.5 is 240 degrees from 1013.5, while 1269.75 is 270 degrees from 1013.5.  If we do end up making a token new high before T13 ends, I expect one of these two targets will prove to be your ultimate price top.

The Gann Wheel can be uncanny.  For example, in January of 2009 we rallied to 944 on the S&P before falling to 667 on March 6, 2009.  663.5 is a 360 degree turn from 944.75 on my Gann Wheel.  

Another example:  Gold peaked at $730 on May 12, 2006 and peaked again at $1034 on March 17, 2008.  On my Gann Wheel, 1032.25 is 360 degrees from 732.25.

Friday, October 15, 2010

$$ Where We Are

After the spike on October 13 (that coincided with the end of the Money Flow T), I wrote that I was expecting one of two scenarios to unfold (assuming the general forecast was correct that T13 ends soon and gives way to a new bear market) :

"1.  October 13 marked an interim top; we correct into October ~20 then push higher into the second week of November before declining rapidly into the nulled echo low.

2.  October 13 started a fresh divergence topping process where October 20 will be the middle of the divergence, suggesting a final price top for T13 on or about ~October 27.  From there, there is a short term correction and then a rally into November 12 that falls short of the October high and fails, leading to a steep decline into the nulled echo low.  Basically, a fractal of what happened in April-May."

As of the close today, both scenarios are still in play.  I alert you that a third scenario exists: 
 
3.  The Money Flow T called the exact end of T13 on October 13, and we will not see 1184 again on the S&P for several years. 

While I think this third scenario is relatively unlikely (given what the other cycles show), you saw what Foreclosuregate did to the banks on Thursday and Friday.  Should the mortgage crisis start to metastasize next week across the broad market,  it might bring down the whole house of cards. 

$$ Interesting Fractal: QQQQ 2000 vs. SPY Today

Compare the chart pattern of the NASDAQ in 2000 to the chart pattern of the S&P today:


Note the flash crash analog in the Qs in early April of 2000.  The price behavior in the months after each flash crash episode is eerily similar.  Of course, we all remember what happened to the NASDAQ beginning in September of 2000:


Hat tip to Slope of Hope for the idea to compare these 2 charts. 

Wednesday, October 13, 2010

$$ Today's Advance Decline Oscillator Breakout & Its Impact on the Forecast

Today I received a couple of excellent questions in the "comments" section of my post about T12:

do you have any comments on the breakout in your oscilator today? is this a new T? or will it form a bearish T?

Here is what the reader is asking about:


As you can see, there was a breakout today in my Advance Decline Momentum Oscillator, interrupting the divergence pattern that was in progress since September 13.  This is not unusual.  Something very similar happened in March of this year:


If you'll notice, there was divergence from March 5 to late March, but price kept powering up.  The oscillator breakout we saw today is similar to the oscillator breakout on April 14.

Now, in April we got some divergence off that April 14 oscillator peak into the final price top on April 26.  But then, the Money Flow T (see this morning's video) was projecting an April 26 top.  Here, the Money Flow T is projecting an October 13 top.  So we may not get any further divergence - we'll have to see.


If we do get some more divergence here based off today's oscillator peak, what is likely happening is that we are forming a major top where October 20 will be at the middle of that divergence.  So, instead of a cycle low on October 20, it will turn out to be a cycle peak.  As you can see, the next date on that cycle is December 13 which is approximately where the nulled echo low should fall.  

If it plays out this way, the late August low to the October 20 peak to the December 13 low pattern will look very similar to the pattern on the second chart above - early February low to the mid April peak to the early July low.

To summarize, I am currently expecting one of two scenarios to unfold: 

1.  October 13 marks an interim top; we correct into October ~20 then push higher into the second week of November before declining rapidly into the nulled echo low.

2.  October 13 starts a fresh divergence topping process where October 20 will be the middle of the divergence, suggesting a final price top for T13 on or about ~October 27.  From there, there is a short term correction and then a rally into November 12 that falls short of the October high and fails, leading to a steep decline into the nulled echo low.  Basically, a fractal of what happened in April-May.

We should know one way or the other very soon.

$$ A Look Back at T12


This video re-examines T12, including start date and center post options as well as top date projections.

$$ Money Flow Ts


This video discusses the phenomenon of the Money Flow Index peaking in the middle of a strongly trending move, then the Money Flow Index diverging from price.  Note that you don't always find this divergence in every strong move.  Further, even when you do, the Money Flow Index peak does not always split the move exactly in half.  But it happens often enough that I pay attention to it. 

Monday, October 11, 2010

$VIX Ratio Low


This video shows how each successive low in the VIX:VXV ratio coincides with an important top shortly thereafter.  The VIX measures 1-month  implied volatility on S&P options, while VXV measures 3-month implied volatility.  Today, the ratio spiked down to 0.79, a 3-year low.  What this means is that the options market participants are complacent about short term implied volatility.  Usually, complacency is a good recipe for a surprise. 

Monday, October 4, 2010

$$ Cycle Turn Dates

Current projection:

Cycle low on or about October 18.  EDIT 10/7 - Now October 20.

We have gaps to fill on the S&P cash at 1109.55 and 1090.10 which roughly correspond with 38% and 62% Fib retracements of the latest move.  These are the price targets on which I am focusing.

We'll see what we get after mid-October, but the longer range forecast shows ~November 12, 2010 as the end of a 3.5 year bear-bull cycle that includes the bull run from March 2009 to the present. 

In other words, after mid-November, we should start another long term bear-bull cycle, the first ~18-36 months of which should be a bear market in stocks.  For more information, see Terry Laundry's free website called T Theory Observations.

Too early to tell yet, but between mid-October and mid-November 2010 we could conceivably see one final push higher on the S&P, perhaps back to the 1150-1220 range. 

Tuesday, September 21, 2010

Thought Provoking

"If ye love wealth better than liberty, the tranquility of servitude better than the animating contest of freedom, go home from us in peace. We ask not your counsels or arms. Crouch down and lick the hands which feed you. May your chains set lightly upon you, and may posterity forget that ye were our countrymen."

-- Samuel Adams, speech at the Philadelphia State House, August 1, 1776

We could use a Samuel Adams about now.

****************
"A democracy cannot exist as a permanent form of government. It can only exist until the voters discover that they can vote themselves money from the public treasure. From that moment on the majority always votes for the candidates promising the most money from the public treasury, with the result that a democracy always collapses over loose fiscal policy followed by a dictatorship. The average age of the world's great civilizations has been two hundred years. These nations have progressed through the following sequence: from bondage to spiritual faith, from spiritual faith to great courage, from courage to liberty, from liberty to abundance, from abundance to selfishness, from selfishness to complacency from complacency to apathy, from apathy to dependency, from dependency back to bondage."

-- Alexander Tyler, writing about the fall of the Athenian Republic.

I'd say the majority of our countrymen are between selfishness and dependency, as we slowly roll-over into bondage.

$$ Dollar Head & Shoulders

We are at the neckline.  If the pattern is valid and we break below the neckline, the target is 71.  I shouldn't have to mention what a fall from 80 to 71 would mean for gold and silver.

Sunday, September 19, 2010

$$ Video on VIX Sell Warning

And how it correlates with the AAII sentiment survey.  Here's the link to the video if you can't get it to play right. 

Friday, September 17, 2010

$$ New Video on How to Interpret S&P% Above 50MA Chart

If you are having trouble, click on the link at the top of the video to watch it on YouTube:

Thursday, September 16, 2010

$$ Excellent Article Summarizing the Problems of Japan

Entitled "When Japan Collapses," it's worth your time. 

$$ AAII Sentiment: Wildly Bullish

Bullish sentiment hit 51% this week in the AAII survey. It is the highest bullish sentiment of the year, topping the January 14 (47%) and April 15 (48%) readings.  

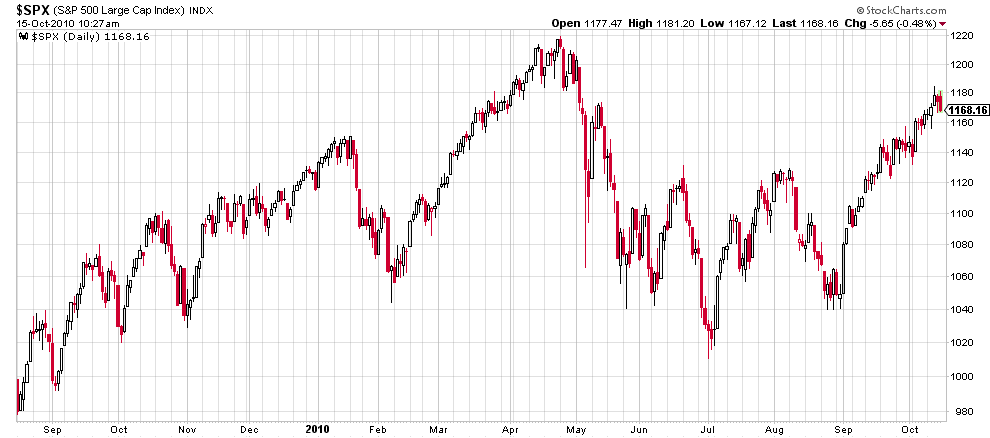
What happened earlier this year after bullish sentiment made a yearly high?  The S&P topped on January 19, falling 100 points in the next 13 trading days.  And the S&P topped on April 26, plunging 155 points over the next 7 sessions.

The spread between bullish and bearish sentiment is 27%, the highest reading since May 8, 2008.  What happened after May 8, 2008?  The S&P topped on May 19 at 1440 before losing 240 points in the next 38 trading days.  

Be careful out there.  

$$ Cycle Turn Dates

Using my Advance-Decline oscillator, here are my current projected cycle turn dates for the S&P:

Top
September 22 (based on the accumulation pattern at the July 2 low)
September 29-October 1 (based on the accumulation pattern in late August)

I expect the top to form in this late September range.  I'm watching to see if a distribution pattern develops.  

Bottom
October 11-18 (based on the distribution pattern in early August)

These turn dates are subject to change as information develops.  For more on my Advance-Decline oscillator, see the September 9, 2010 blog entry below.

Thursday, September 9, 2010

$$ A Unique Momentum Oscillator

The Advance Decline line has been around forever, as has the CBOE Put-Call ratio.  I divide the AD line by the Put-Call ratio to get a momentum oscillator that provides excellent bullish and bearish divergence signals (for when trends are about the change) as well as positive and negative reversal signals (for when trends are about to continue).


As an example of the latter, compare how the higher momentum peak in the mid-June rally vs. the mid-May rally was unable to produce a higher high in price in June, thus signifying the downtrend was strong and about to continue.


Edit - Terry Laundry published my Advance-Decline momentum oscillator in his September 15, 2010 post at the T Theory Foundation site.  He had some nice things to say about my oscillator in his audio comments as well.