Compare the chart pattern of the NASDAQ in 2000 to the chart pattern of the S&P today:

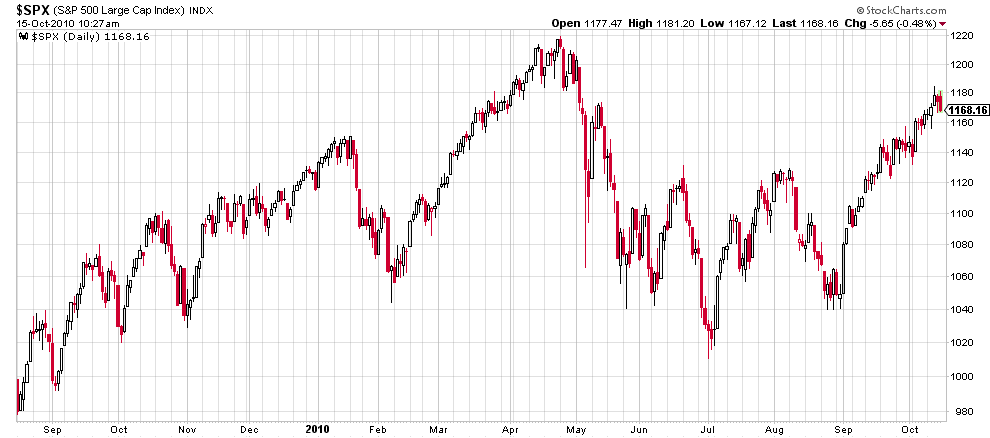
Note the flash crash analog in the Qs in early April of 2000. The price behavior in the months after each flash crash episode is eerily similar. Of course, we all remember what happened to the NASDAQ beginning in September of 2000:


No comments:
Post a Comment